Testing Network Bandwidth? Use IPERF
During a recent project, I wanted to check the bandwidth or throughput available across various portions of our network. This was part of a task to collect performance results on a virtualised environment.
There are quite a large number of network portions or layers that make up the Crucial network. We have gigabit, 10gbe, and 100Mbit connectivity. As we grow, so do the many devices that make up our network, and the varying services that operate on it.
I needed a point to point tool that would let me check the bandwidth available across the varying portions above to ensure certain services are getting the required throughput to operate at an optimum level. I looked for a tool that was easy to use and displayed the result in a simple fashion. The aim was a quick test, with quick to record results.
I came across a great linux based tool called IPERF that helped me achieve the above goal. IPERF is on sourceforge, http://sourceforge.net/projects/iperf/
In the remaining part of this blog I will look at how I used IPERF to check the throughput of our network.
Install IPERF
First step is to install IPERF. You will need to install this tool on both a source and destination host.
For all our testing we use Centos 5.8 virtual or physical environments. I prefer to install via RPMForge (now known as RepoForge). Please note there is also a Windows version available by heading over to, http://www.iperfwindows.com.
RPMForge is basically an additional package repository you can add to your Centos setup, so you can install more packages via the yum command line tool. More information about using RPMForge can be seen here, http://repoforge.org/use/ or here, http://wiki.centos.org/AdditionalResources/Repositories/RPMForge
- Download the RPMForge package that adds the RPM Repo to the yum repo list. The link below is for the Centos 5 x86_64 version, at the time of writing.wget http://packages.sw.be/rpmforge-release/rpmforge-release-0.5.2-2.el5.rf.x86_64.rpm
- On the server which you downloaded the packge run the following,rpm –import http://apt.sw.be/RPM-GPG-KEY.dag.txt
- Verify the install rpm file by running,rpm -K rpmforge-release-0.5.2-2.el5.rf.*.rpm
- Now install the rpm file,rpm -i rpmforge-release-0.5.2-2.el5.rf.*.rpm
Once this is done, you are now able to run,
yum install iperf
Using IPERF
IPERF has two functions, server and client. You can look at the server function being the “destination” and the client as the “source”.
It is very simple to run IPERF in server mode. You simply run,
iperf -s
This will enable the iperf tool in a listening (server) mode.
The next step is to run the iperf tool’s client options at the source location.
IPERF has a range of parameters allowing you to control what it is doing, and the results it gives you. However to kick off a simple test you can run the following,
iperf -c 1.1.1.1
You can replace 1.1.1.1 with the IP Address of the server / environment running the server version of iperf.
Note: Make sure you open up the necessary ports in both source and destination related firewalls.
I will run through some of the other optional parameters that were useful in my investigations. The thing to remember here is you can run multiple parameters though my examples only show one parameters at a time, you can combine these when you are running your tests.
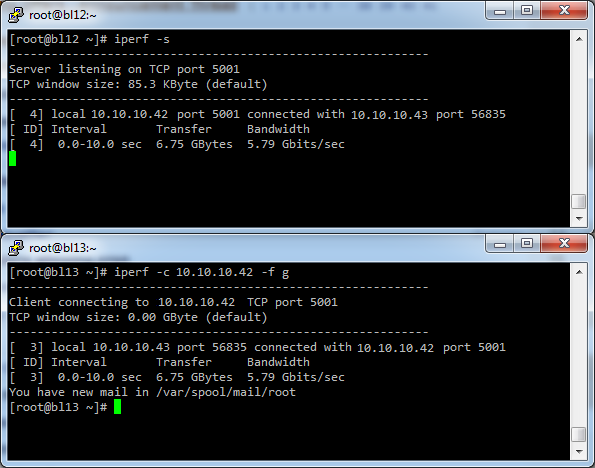
Formatting Results – To ensure I was reading the results clearly I modified the output results into Gigabits and Gigabytes. However you can set it to bites / bytes, kilobites / kilobytes, and megabits / megabytes.
iperf -c 1.1.1.1 -f g
- G for Gigabytes per second
- g for Gigabits per second
- M for Megabytes per second
- m for Megabits per second
- K for Kilobytes per second
- k for Kilobits per second
- B for Bytes per second
- b for Bits per second

Setting Specific Port – The default port used by iperf is 5001 however you may wish to specify a certain port.
iperf -s -p 9999
iperf -c 1.1.1.1 -p 9999
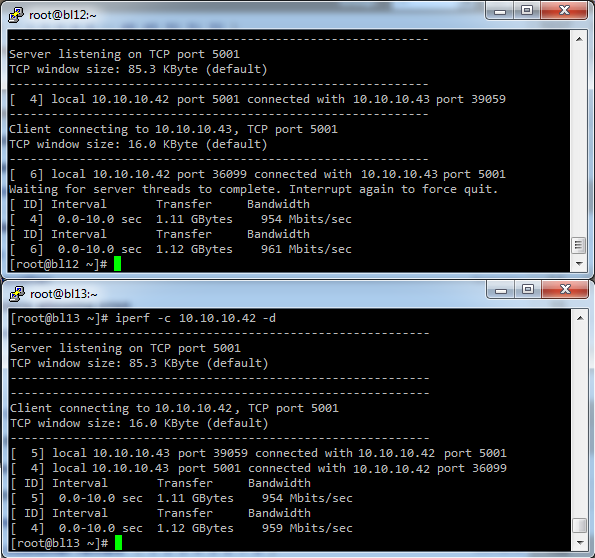
Checking Full Duplex – By default the test will push traffic from the client to to the server (source to destination), which is one way. If you want to test both directions (at the same time), then you need to run the duplex option to test the full duplex of the connection.
iperf -c 1.1.1.1 -d
You will see speed results display by both the server and client side, so watch both!

Window Size – When you run iperf tool you will notice it indicates a “TCP Window Size” which is calculated automatically unless specifically set. The window size can be between 2 and 65,535 bytes.
iperf -s -w 4000
iperf -c 1.1.1.1 -w 4000
You can set this on both the server and client side.
I kept this as the default using my testing, however if you do wish to modify the window size, then I would suggest keeping them the same for the client and server to avoid confusion.
Also keep in mind that on Linux based system, the kernel allocates double as much as indicated by the -w setting you’ve configured.
Test Length – By default the test will only run for 10 seconds, which is often not a long enough time to get a solid result, or get enough traffic going to appear on graphing you may have running else where. IPERF provides the ability to set how long the test can run for in seconds.
iperf -c 1.1.1.1 -t 60
This would run the test for 1 minute.
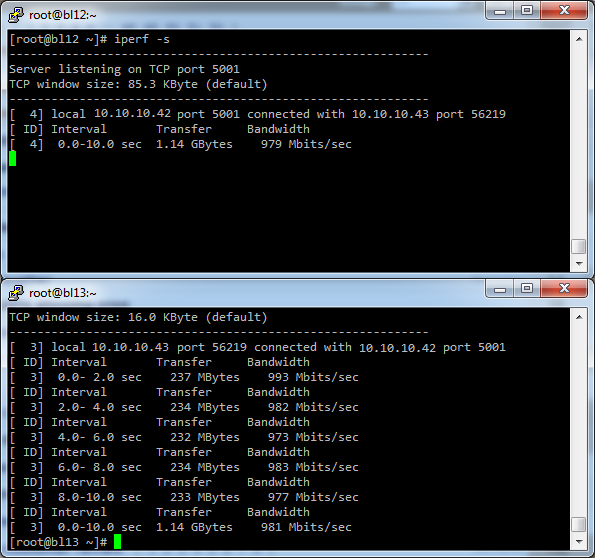
Bandwidth Reporting Frequency – By default during the test you only receive a result at the end of the test, however if you are running a longer test you may want to get regular updates on the speed. IPERF has the ability to set intervals (in seconds) for reporting speed results.
iperf -c 1.1.1.1 -i 2
This will report every 2 seconds during the length of the test.

Running Multiple Tests – You may have a need to run multiple instance of the same test to see how the bandwidth throughput holds up. IPERF has an ability to run multiple’s of the same test in parallel.
iperf -c 1.1.1.1 -P 2
This will run the test twice at the same time.
I’ve covered some of the parameters that IPERF offers that I directly used. However I would note there are a few others mainly relating to MTU and using UDP traffic instead of the default of TCP. To get a full list of the parameters available you can run,
iperf -h
This will output the help options associated with the IPERF Tool.
I hope this has given a bit of a summary on how to get started with the IPERF tool.
Feel free to leave a comment about how you’ve used IPERF to diagnose network speed / throughput issues. If you have any recommendations on any other tools, let us know?
| Hosting Options & Info | VPS | Web Solutions & Services |
|---|---|---|
-
Arjen Lentz
